Xiaohongshu Data Extractor
Impact
Problem
The marketing team managed 20+ Xiaohongshu (Little Red Book) creator accounts for clients, split across 3-4 people. Xiaohongshu has no public API and no data export feature. The Creator Center dashboard only shows yesterday's data after a fixed daily update time, and the data had to be copied out manually, field by field, into spreadsheets. At ~15 minutes per client, this added up to ~5 hours of daily data collection across the team, including weekends. Copy-paste errors were common, and team members sometimes forgot to collect data on busy days, leaving gaps in client reporting.
I noticed the team struggling with this and discovered that the web requests behind the dashboard contained complete, structured data. That became the basis for the tool. Part of my role was optimizing internal workflows, so even when busy with other projects, I made time to build and iterate on this.
Key Decisions
-
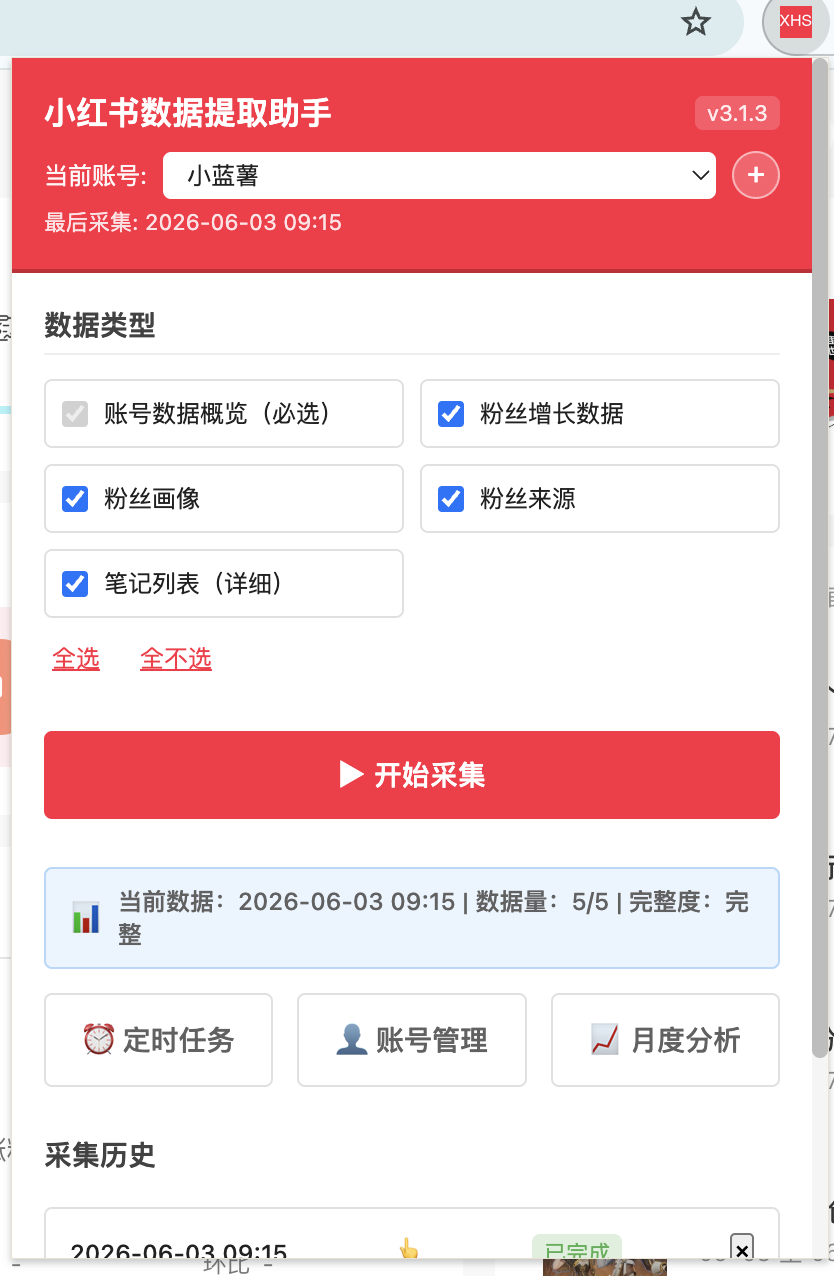
Why move from Golang CLI to Chrome Extension?The Golang CLI worked and the team could use it with basic onboarding. But as the team grew, the cookie workflow became a friction point: cookies expired unpredictably, and by the time it happened again, team members had forgotten the steps. A Chrome Extension rides on the browser's existing session. No cookies to copy, no terminal, no expiry. Install once, click to collect.
-
How do you get the data without a public API?The extension directly calls the same API endpoints that the Creator Center dashboard uses, using the browser's existing session cookies for authentication. It uses Chrome's declarativeNetRequest to set the correct referer headers. This is an active fetch approach, not passive interception. When XHS changed their dashboard versions, I only needed to update the endpoint URLs and response parsing.
-
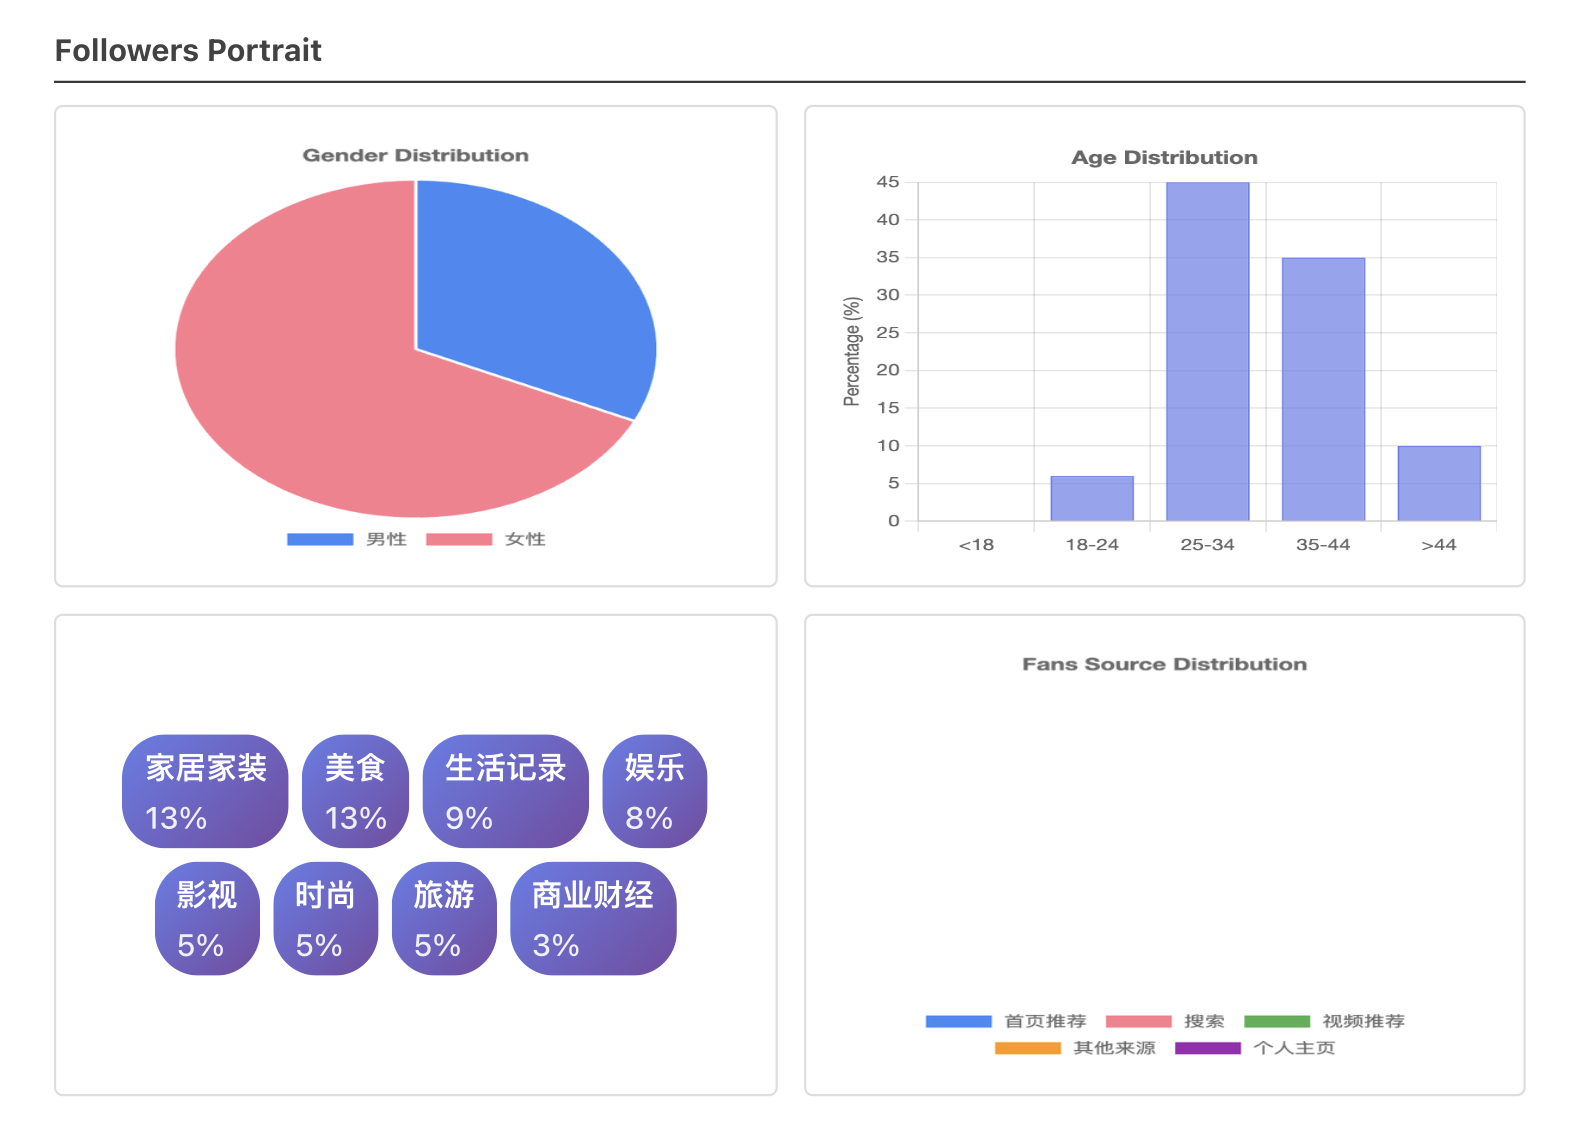
Why build visualizations and reports into the extension instead of just CSV export?XHS eventually added their own export feature, but the exported data was still incomplete. Our tool already captured richer data from the web requests. The original workflow was: copy data, paste into Google Sheets, manually create charts, paste charts into client reports. Building visualizations and a monthly PDF report directly into the extension eliminated those steps. New team members could generate a client-ready report in a few clicks.
Architecture
Transferable Pattern
Extracting structured data from platforms without APIs. Applicable to any marketplace or social platform where the brand operates: Shopify analytics, TikTok Shop, Lazada seller center, or any internal dashboard that lacks export functionality.